Twitch Analytics · Dashboard · Europe
Twitch Stream Analytics
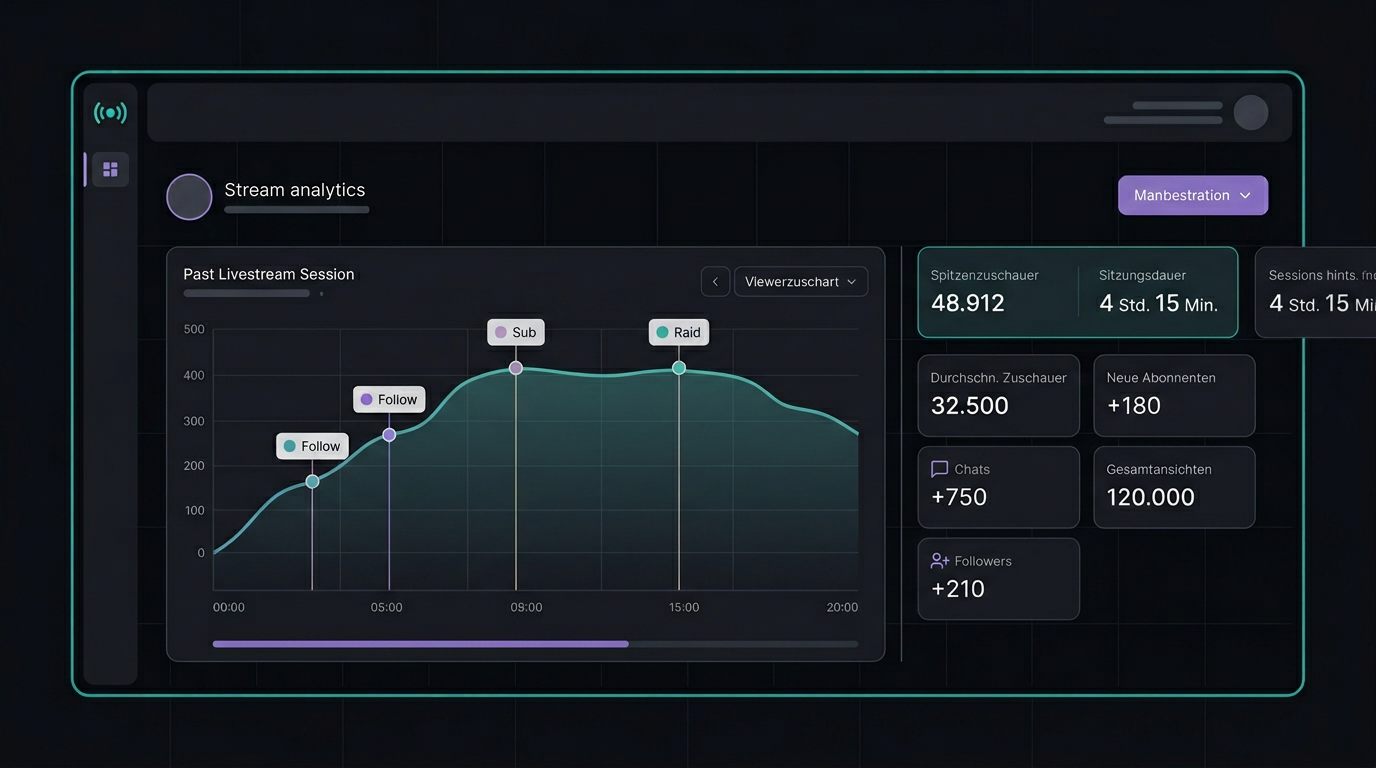
When the camera is off, the reflection begins: When did the viewer count spike? Did the raid come before or after the peak? Streamboard summarizes the stream clearly – with a timeline that highlights key moments like follows, subs and raids. For creators in Europe who prefer clarity over tab chaos.
How does analytics relate to live notifications?
This page is Streamboard's analytics landing page (also called stream analytics): after the stream, charts and events help you reflect; at the same time you can prepare Discord and Telegram notifications for your next go-live. Full overview: Features · FAQ.
Why Twitch analytics in the dashboard matters
Twitch Analytics in Streamboard is built for practical value: you spot patterns in your stream history without navigating deep menus. Ideal for solo streamers and small teams who want a quick debrief after the stream.
Viewer statistics in context
The curve shows how your audience moved during the broadcast – not just a number at the end, but the progression over time.
Timeline: Follow, Sub, Raid
Key moments appear as markers on the timeline. See at a glance whether a raid pushed the curve up or whether follows came in clusters.
One place for the review
Instead of scattered screenshots and notes: the board bundles analysis and setup – from Discord notifications to post-stream reflection.
Typical markers on the timeline
- Follow: New viewers subscribed during the stream – clearly visible when several happen in quick succession.
- Sub (or gift sub): Support right in the stream timeline – helps gauge whether community actions brought energy to the program.
- Raid: Incoming raid wave – often visible just before or during a peak in viewer statistics.
Gains and losses: the follower timeline that also shows the drop-offs
Almost every growth chart only shows how many followers you gained. Streamboard shows you both, day by day – gains and losses across the last 30 days, plus the net result. And with Premium the number turns into a list: Unfollower Insights show you by name who stopped following your Twitch channel.
Gains and losses in the same chart
For each of the last 30 days you see how many followers arrived – and how many left. Losses are derived from daily snapshots: nothing to set up, and free for every account.
Unfollower Insights (Premium)
With Premium the loss count becomes a list of names: who unfollowed, how long they had been following, and when we detected it. That tells you whether regulars are leaving or just short-lived follows are dropping off.
Net growth instead of gut feeling
+120 followers with 40 drop-offs is a different story than +120 without a single loss. The net figure combines both sides in one number – exactly the difference pure growth curves leave out.
To be fair: what works and what does not
- Free for everyone: the 30-day gain/loss timeline and the net figure need no Premium.
- Names only with Premium: unfollower tracking starts when your Premium starts – unfollows from before that cannot be reconstructed afterwards. Once detected, unfollows are stored permanently.
- Twitch only: Kick and YouTube offer no person-level follower APIs. There are no unfollower names there – and we will not invent any. Detection can take up to roughly 6 hours.
What Twitch analytics in the board gives you
Orientation after going live: concrete takeaways instead of vague impressions – all in the same interface as your setup.
-
Peaks with clear event context
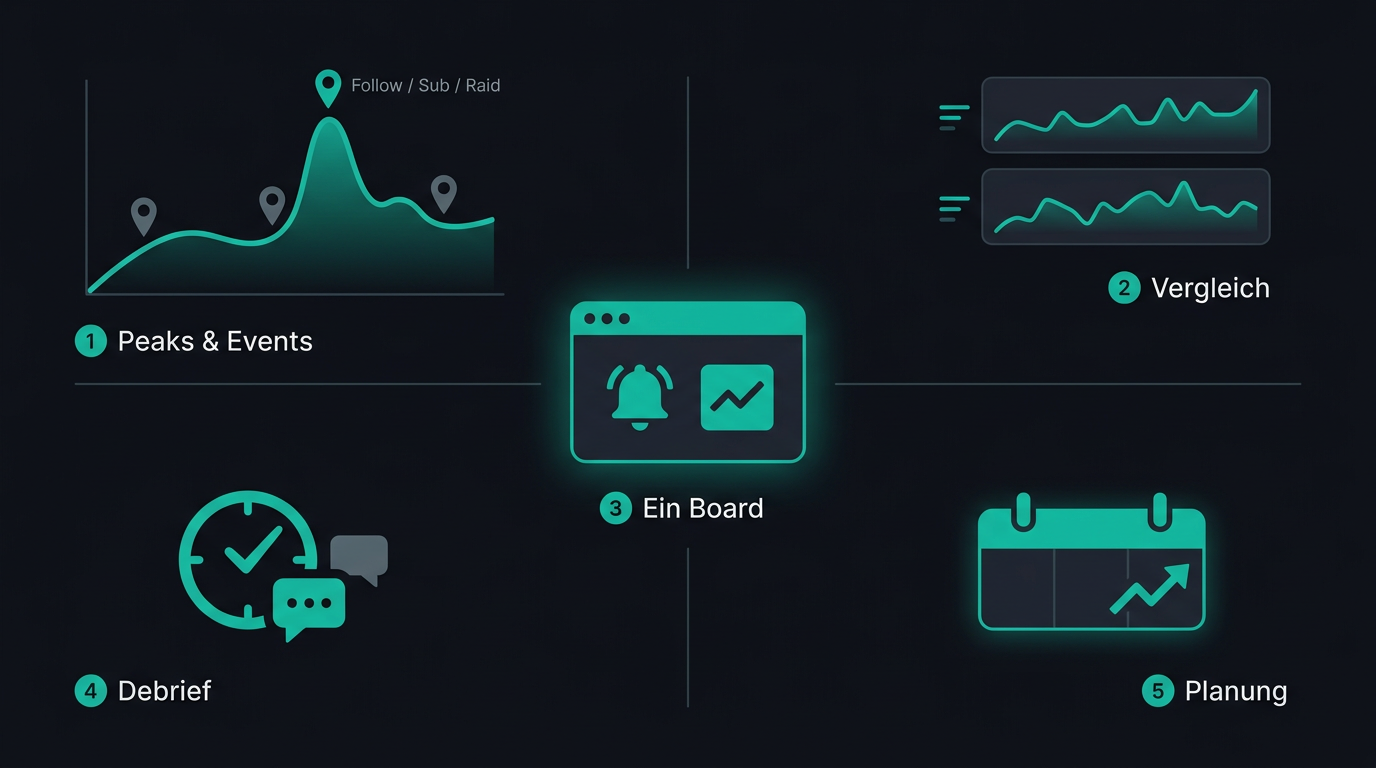
Viewer highs and lows sit on a timeline; follows, subs and raids appear as markers on the same screen. You see immediately which event coincides with a spike or dip – no need to manually cross-reference chat logs or spreadsheets.
-
Comparable sessions with consistent layout
Every past broadcast uses the same layout for curve and markers. This lets you compare sessions fairly: same axes, same event types – whether it's a morning slot, a collab or a long feature program.
-
Fewer tool switches in daily life
Having Twitch live, Discord/Telegram notifications and analytics in the same board reduces context switching. You stay in one system for setup and review instead of using three portals in sequence.
-
Quicker wrap-up right after the stream
History and markers are already stored and structured. Moderators and co-hosts can review the session with you in minutes – without collecting screenshots or opening external stats sites.
-
Decisions for the next broadcast schedule
See whether peaks correlated with scheduled segments, raids or community actions. This provides an objective basis for title choices, slot length and recurring segments – without relying on gut feeling alone.
Frequently Asked Questions
What is "Twitch Stream Analytics" at Streamboard?
The curated view of a past broadcast: viewer trends over time plus markers for moments like follows, subs and raids – bundled in the dashboard.
Can you see follows, subs and raids on the timeline?
Yes. These events are mapped to the stream history so you can connect peaks and community reactions in one view.
Who benefits from the analytics?
Creators and small teams who want to reflect after the stream and improve their next broadcasts – without complex toolchains.
What are the best stream analytics tools available?
Creators compare Twitch’s native stats, third-party dashboards (e.g. StreamElements, SullyGnome), and all-in-one boards. Streamboard focuses on practical post-stream review: viewer curves, event timelines with follows, subs, and raids, plus go-live setup in one dashboard.
Try Twitch Stream Analytics in your own board
Create an account, connect your channel and check the history after your next broadcast – that's how Twitch Analytics becomes part of your workflow.